
Examining motifs using multiple sequence alignment in KNIME with the SeqAn Community extension
In a previous blog article, Blast from the Past we traveled back in time to investigate ancient DNA. As we learned in the article, DNA consists of a sequence of nucleotides, which can be viewed as very large strings like this: AGTCGCAGAGT...
Decoding this sequence of different species uncovered that humans and chimpanzees share perfect identity with 96 percent of their DNA sequence1.
Why do we look so different then? Little differences with huge effects can appear in regulatory regions of our genome. A regulatory sequence is a segment of a DNA to which specific proteins can bind, thereby influencing gene expression (synthesis of a functional gene product). These sequences are often conserved within a species, as small changes can have deleterious effects. Short conserved sequence patterns with a biological significance are called motifs. What happens if changes appear in these motifs? And how can we find out? This is where bioinformaticians come into play.
Keywords: sequence motif, sequence logo, multiple sequence alignment, beta thalassemia
Motif Beta Thalassemia
In this blog post, we have selected a motif - in which changes can lead to an inherited blood disorder, known as beta thalassemia - and want to take a closer look at it. We do this by introducing you to one of the most fundamental bioinformatics methods: multiple sequence alignment. To realize this in KNIME Analytics Platform, we make use of community extensions that allow us to easily analyze biological sequences. In order to visualize the results, we create a sequence logo using a Generic Javascript View. A sequence logo is a frequently used graphical representation of the sequence conservation of nucleotides from alignments.
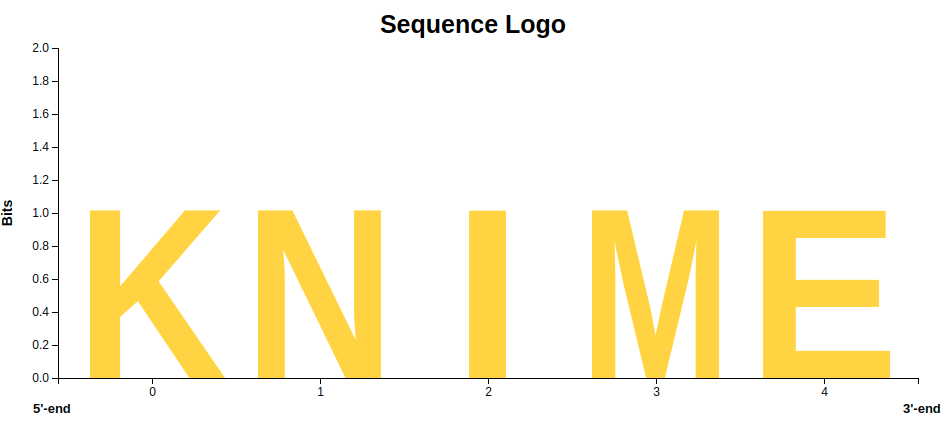
It is of course also possible to visualize non-DNA letters, should you want to show people a sequence of your interest like this:
Aligning Multiple Sequences
Aligning multiple sequences is one of the most common tasks in the field of bioinformatics, as it allows these sequences to be systematically compared. A multiple sequence alignment (MSA) can provide information about related sequences while taking mutations, insertions, deletions, and rearrangements into account2. It is possible to align either nucleotide or protein sequences with the goal of finding motifs or conserved regions, analyzing domains, or detecting phylogenetic relationships.
Often many sequences are compared with each other. This makes it difficult to immediately recognize patterns or conserved regions. To simplify this, a sequence logo can be used, which allows for a compressed representation of multiple sequences without any loss of information.
In this example, we will have a look at the promoter region of the HBB (Hemoglobin Subunit Beta)3 gene. A promoter region is the part of a DNA sequence that is important for the initiation of transcription of a gene. This, in turn, affects the production of specific proteins, as in the case here of the beta-globin protein. Beta-globin is a subunit of hemoglobin, a larger protein located within red blood cells with the job of transporting oxygen throughout the body.
Mutations in the HBB gene can lead to triggering certain diseases. The promoter region we are looking at in this example is the so-called TATA- or ATA-box, to which a protein called TATA-binding protein binds. This interaction plays an important role in the initiation of the transcription. If transcription is negatively affected by mutations, this can decrease or even stop production of beta-globin altogether4. As a result, the beta-thalassemia5 condition can be incurred, in which the number of red blood cells is lower than normal. This can lead to minor symptoms such as pale skin, weakness, or fatigue. In worse cases, blood transfusions are required, which can lead to an abundance of iron in the body. This results in problems with the heart, liver, and hormone levels.
Analyzing DNA motifs using KNIME Analytics Platform
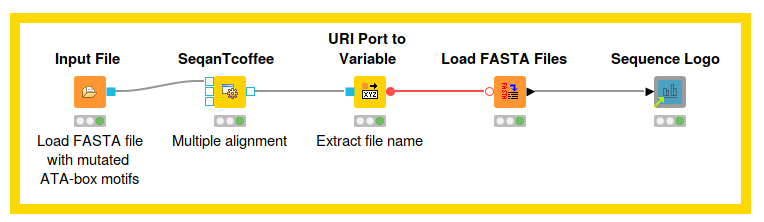
To satisfy your curiosity as to how mutations in motifs can help us learn more about the genetic basis of specific diseases, we created an example workflow (see fig. 1), which shows just how it works. You can download the Seqan Tcoffee (Multiple Alignment) and Sequence Logo workflow from the KNIME Hub.
First, we load the different sequences containing the mutations as a FASTA file, using the Input File node. In the next step, we insert the SeqanTcoffee node from the SeqAn Community extensions to create a multiple alignment. If you’re not sure how to install these extensions, refer to the website: Seqan nodes in KNIME.
We now take this multiple alignment and create a sequence logo using the Generic Javascript View. This pinpoints the position at which mutations in the motif have occurred.
To give you a more detailed insight into the individual steps, we will describe the nodes we used in figure 1 in the following sections. Stay tuned!
Biological Sequence Format – FASTA
In bioinformatics, the FASTA6 file format is commonly used for representing either nucleotide or amino acid sequences. In our example, we used a multi-FASTA file with different ATA-box motifs as the input. The ATA-box motifs shown in fig. 2 belong to people who are suffering from beta-thalassemia.
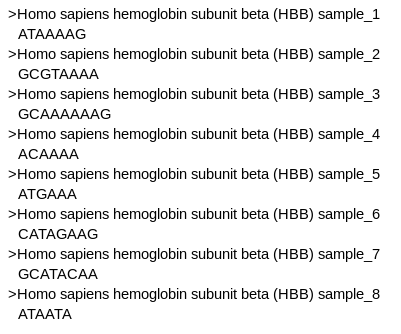
The file begins with a single line description of the sequence followed by the sequence itself. The description line contains for example gene name, species or just a comment and it always starts with ‘>’, which can be recognized by several algorithms and tools. KNIME Analytics Platform provides functionality to read FASTA files as well by using either the Input File node or the Load FASTA Files node from the Vernalis Community Extension. This FASTA file shown in figure 2, including the corresponding sequences, serves as the input for the T-Coffee multiple sequence alignment in the next step.
Multiple Sequence Alignment – T-Coffee
To analyze that specific ATA-box motif, we use the SeqanTcoffee node from the Seqan Community Extensions. T-Coffee7 (Tree-Based Consistency Objective Function for alignment Evaluation) is a method that is based on a progressive approach to increase the accuracy of aligning multiple sequences. The first step of the algorithm is to generate primary libraries, which contain sets of pairwise alignments. By default, two libraries are generated: global pairwise alignments using ClustalW8 and local alignments using Lalign from the FASTA package9. It is also possible to calculate the pairwise alignments beforehand and to use common libraries such as BLAST10 and MUMmer11. That’s why there are 3 input ports for the T-Coffee node. The first receives a multi-fasta file as input and the other two optional ports can read in already aligned sequences in different file formats.
In the next step the initial libraries are combined into a single primary library. A distance matrix is calculated from that library. This distance matrix is used to compute a guide tree, which represents the relationships between the sequences. In order build the tree clustering, methods such as Neighbor-Joining12 or UPGMA13 are used. In the final step the multiple sequence alignment is built from the guide tree by adding the sequences sequentially, beginning with the most similar pair and progressing to the most distantly related.
While the sequences are added sequentially, the alignments are scored. Gap-open and gap-extension penalties are used for this. Since gap penalties were already applied when calculating the pairwise scores for the primary library, gap-open and gap-extension penalties are set to low values in the progressive alignment by default. These values can be adjusted, depending on the purpose. If your interest is to find closely related matches, a higher gap penalty should be used to reduce gap openings.
Generic Javascript View
KNIME provides a number of possibilities for visualizations via Javascript. In case the built-in JavaScript views are not sufficient for your use case, you can always use customized JavaScript views with the Generic JavaScript View node to implement your own visualizations. In a recent blog post, From A for Analytics to Z for Zika Virus, we discussed how to create your own interactive views using the Generic JavaScript View node. In today’s example, we use the Generic Javascript View to create a sequence logo that can be used in combination with other views such as the Table View. We can get a useful, interactive view by combining both nodes in a component, as can be seen in figure 3. You can download the shared Sequence Logo component from the KNIME Hub.
It uses the output of the multiple alignment to create a logo that shows how well nucleotides are conserved at each position. Highly conserved nucleotides should be displayed as large letters; if we find many gaps or different nucleotides at a position, we want those to be represented by small letters. To achieve that, we calculate the maximal entropy for each position in the sequence. To calculate the individual height of each nucleotide per position, we multiply the maximal entropy with the relative frequencies. The unit that is typically used to measure entropy is bit, basic unit of information.
This logo can be used to visualize certain motifs that occur repeatedly in multiple sequences. It simplifies the evaluation of the results, because we can easily spot where changes have occurred.
A very important feature of the JavaScript nodes is that they all support interactivity between the different visualizations in the component view. This makes it also possible to click on the nucleotides in the sequence logo and see in which sample they occur in that position by using a JavaScript Table View. You can easily use the created code on your own data, adjust it and enjoy the view!
Result
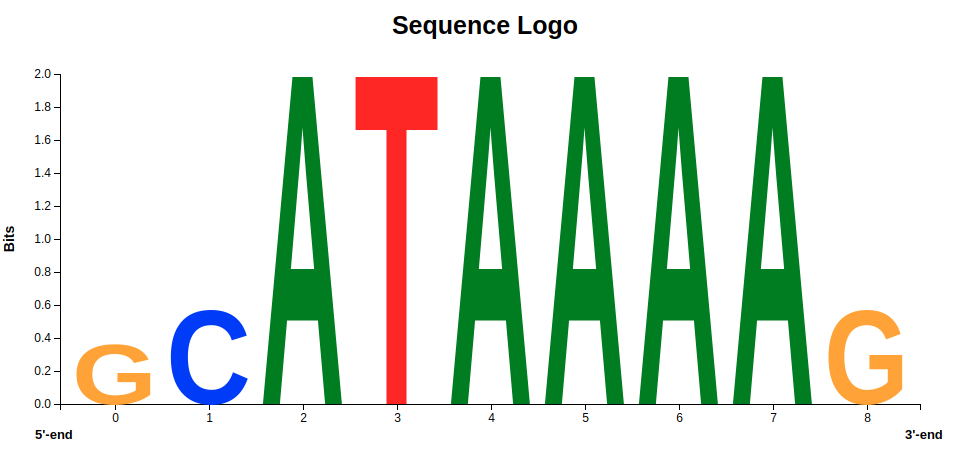
Let’s have a look at the result of the Generic JavaScript View, the sequence logo of the promoter region of the HBB gene. Figure 4 shows the graphical representation of the ATA-box motifs from healthy individuals. The repeating sequence of the ATA box, which typically consists of the nucleotide sequence 5'-ATAAAA-3 ' is clearly recognizable, especially because these nucleotides are displayed the largest.
So far, so good - but what changes in this motif will lead to beta-thalassemia? When we look at the logo in figure 5, we see that other nucleotides occur at the same positions as the ATA-box motif.
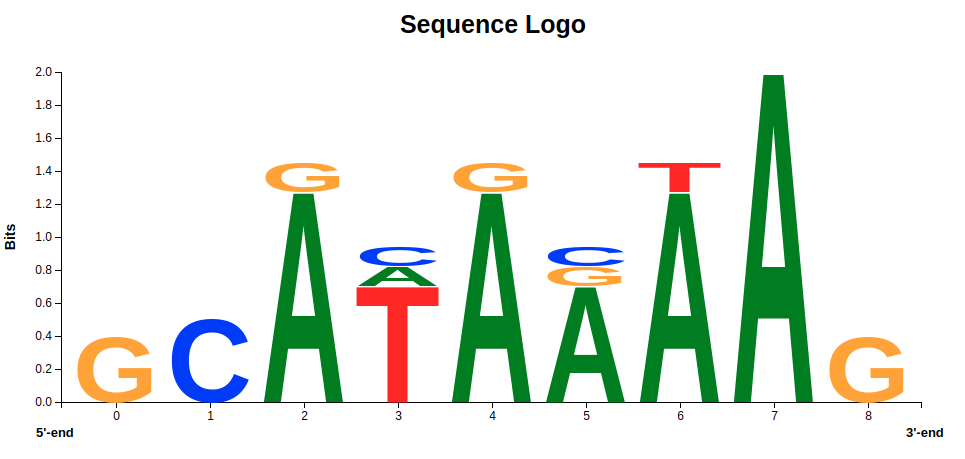
This means that at some point, one nucleotide has been replaced by a different one. In most cases this is harmless and happens constantly in our body, but in our case we observe these changes in patients with beta-thalassemia. This can lead to the hypothesis of a connection between the observed mutations and the disease. Indeed, it has been experimentally verified that these nucleotide changes hinder effective binding of the TATA-binding protein that is needed for the synthesis of HBB.
Summing up
This was a small example of how alignments and visualization tools can be used in KNIME Analytics Platform. You can easily build upon that workflow and adjust it to your needs. Our goal was to show what a comparison could look like between motifs from healthy people and people who are suffering from a disease.
In the first step, we created a multiple sequence alignment of the sequences from healthy individuals and people affected by beta-thalassemia by using the tool T-Coffee. More specifically, we used sequences of a regulatory region, the ATA-box motif, of the gene HBB (Hemoglobin Subunit Beta). The resulting alignment served as input for a Generic JavaScript View in which we created a sequence logo to visualize the results. The reason why this kind of logo is often used in bioinformatics is because it enables us to quickly see where in the sequence changes have occurred. If we assume that sometimes hundreds of sequences are compared with each other, this logo is a simplification to provide us with a quick and fast overview. The sequence logo made it possible for us to detect mutations in the motifs in a simple way and thereby derive hypotheses about the genetic basis of beta-thalassemia.
References
1. New Genome Comparison Finds Chimps and Humans Very Similar at DNA Level
2. Multiple sequence alignment modeling: methods ... - Oxford Journals
3. HBB gene - Genetics Home Reference - NIH
4. The Mechanism by which TATABox Polymorphisms ... - ASSA
5. Beta thalassemia - Genetics Home Reference - NIH
6. FASTA format - The Yang Zhang Lab - University of Michigan
7. T-Coffee: A Novel Method for Fast and Accurate Multiple Sequence ....
8. Clustal W and Clustal X Multiple Sequence ....
10. BLAST: Basic Local Alignment Search Tool
12. Neighbor-joining method: a new method for reconstructing ....
13. UPGMA Method